Figures 6.15


Modeled distribution for Austrochlus species (Diptera: Chironomidae) based on presence data.
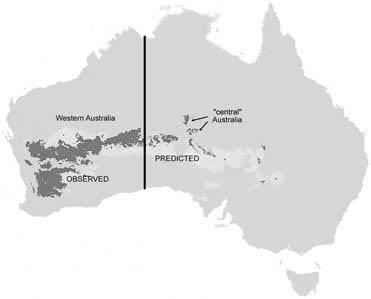
Figures 6.15. Modeled distribution for Austrochlus species (Diptera: Chironomidae) based on presence data.

Black, predicted presence within 98% confidence limits; pale grey, within 95% confidence. (After Cranston et al. 2002)

Previous figure

  Flow diagram depicting the derivation of the “ecoclimatic index” (EI) as the product of population growth index and four stress indices.
Next figure

  A cladogram showing the relationships of four species, A, B, C, and D, and examples of (a) the three monophyletic groups, (b) two of the four possible (ABC, ABD, ACD, BCD) paraphyletic groups, and (c) one of the four possible (AC, AD, BC, an d BD) polyphyletic groups that could be recognized based on this cladogram.