Figures 6.14
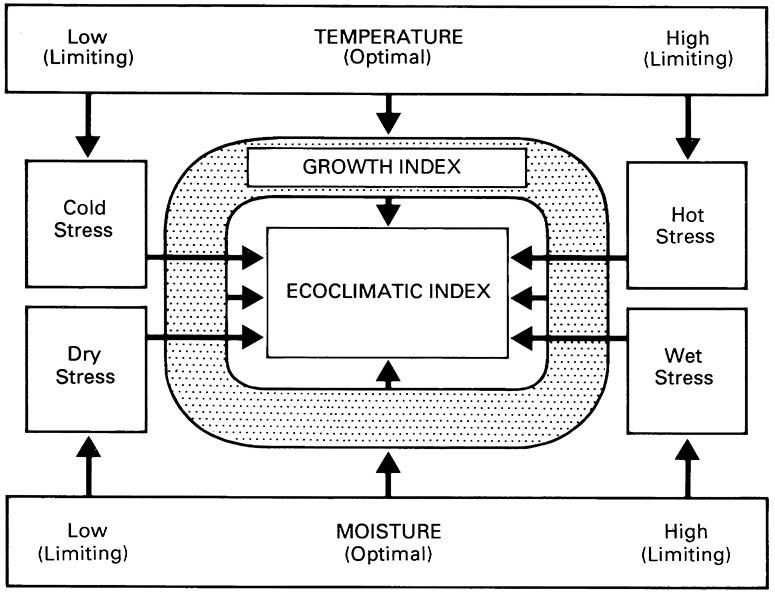
Figures 6.14. Flow diagram depicting the derivation of the “ecoclimatic index” (EI) as the product of population growth index and four stress indices.
The EI value describes the climatic favorability of a given location for a given species. Comparison of EI values allows different locations to be assessed for their relative suitability to a particular species. (After Sutherst & Maywald 1985)

