Figures 16.1
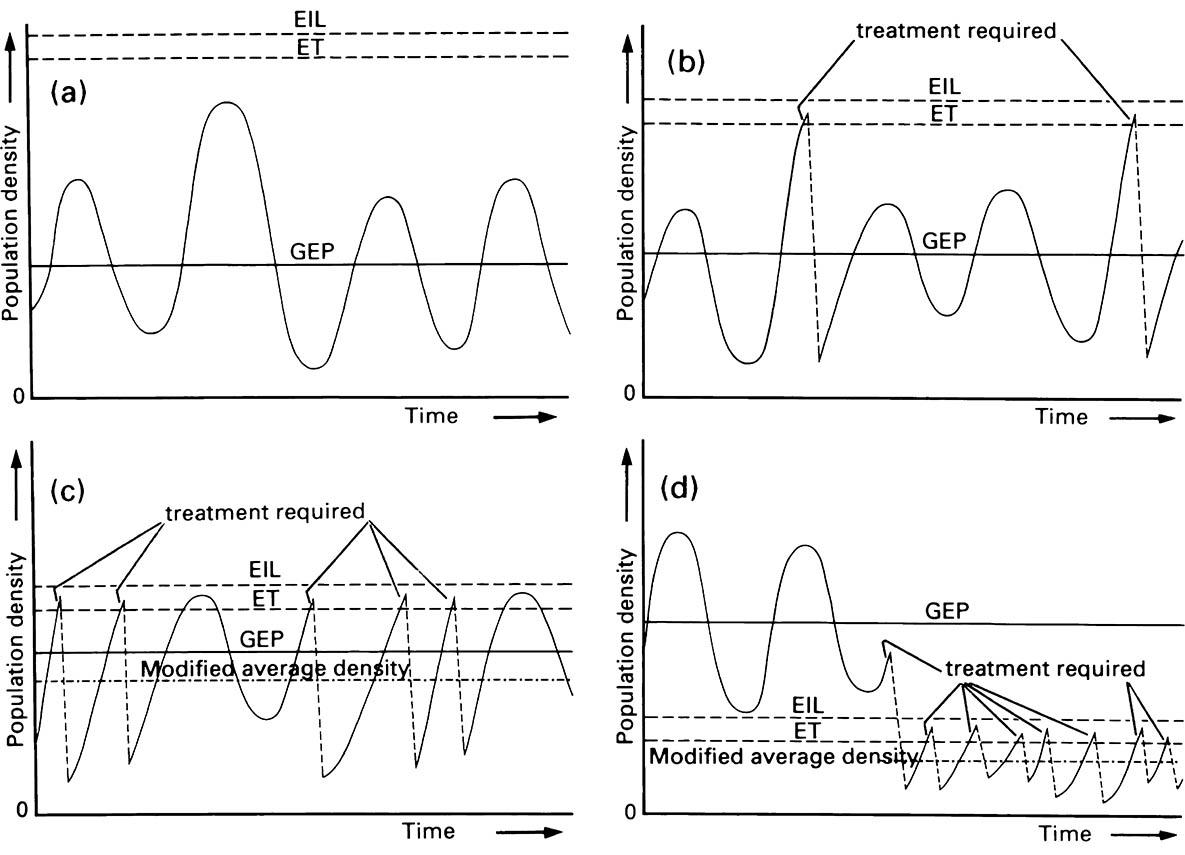
Figures 16.1. Schematic graphs of the fluctuations of theoretical insect populations in relation to their general equilibrium population (GEP), economic threshold (ET), and economic injury level (EIL).
From comparison of the general equilibrium density with the ET and EIL, insect populations can be classified as: (a) non-economic pests if population densities never exceed the ET or EIL; (b) occasional pests if population densities exceed the ET and EIL only under special circumstances; (c) perennial pest s if the general equilibrium population is close to the ET so that the ET and EIL are exceeded frequently; or (d) severe or key pest s if population densities always are higher than the ET and EIL. In practice, as indicated here, control measures are instigated bef ore the EIL is reached. (After Stern et al. 1959)

