Figures 7.5
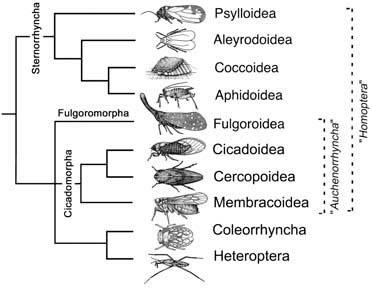
Figures 7.5. Cladogram of postulated relationships within Hemiptera, based on combined morphological and nucleotide sequence data.
Broken lines indicate paraphyletic taxa, with names italicized. (After Bourgoin & Campbell 2002)
Broken lines indicate paraphyletic taxa, with names italicized. (After Bourgoin & Campbell 2002)

